


Inventory of Urban Health Related Data covering the Greater Toronto Area - Supporting Documentation
Cordon Count Data Available through the Cordon Count Program, Data Management Group, Joint Program in Transportation at the University of Toronto
The Cordon Count is a periodic counting program involving over a thousand counting stations across the GTA. It was first performed in 1975 and the most recent data is for 2001. The count was last performed this year and the data should be available by late 2004/early 2005. The cordon count program represents a one-day snapshot of persons and vehicles passing each counting station. The counting stations are organized into screenlines, illustrated on the following map:
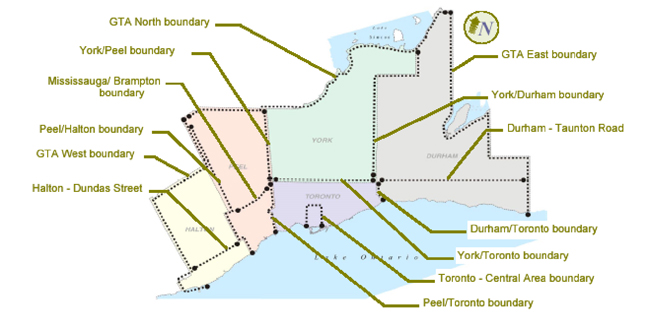
Figure 2: Locations of the Counting Stations Used in the Cordon Count Program
The counts are divided into 15-minute intervals and are stored by station. In many cases, traffic is counted manually, but automatic traffic records are also used. Vehicles are divided into the following classes: autos & taxis, light trucks, medium trucks, heavy trucks and buses (Tsoi, 2004).